Create an Organization Chart easily: Simple Org Chart Guide

Let’s Learn how to create The Easiest Way to Create an Organization Chart with this simple, step-by-step guide. Use SmartArt to visualize your organization chart. Creating an organizational chart (org chart) can seem like a daunting task, but trust me, it’s easier than you might think when you use tools that offer drag and drop functionality. Whether you’re looking to visualize your team structure or just want a clear picture of your company’s hierarchy, all you need are lists of people and their managers. In this guide, I’ll walk you through the best and simplest way to create an org chart, complete with customizable styles and options for adding photos. Let’s dive in!
What is an Organizational Chart?
An organizational chart is a visual representation of a company’s structure, illustrating the hierarchy, roles, and relationships between individuals or departments, including the highest-ranking positions. It serves as a roadmap for understanding reporting lines, responsibilities, and team dynamics, particularly in sales teams where clear roles enhance efficiency.

A Brief History
Organizational charts trace back to the mid-19th century, with early examples in railroad companies to manage complex operations. Engineer Daniel McCallum is credited with creating one of the first formal org charts in 1854 for the New York and Erie Railroad. Over time, org charts evolved from static diagrams to dynamic digital tools, reflecting modern businesses’ need for flexibility and scalability.
Seeking the easiest way to create an organizational chart
I’m on the hunt for a user-friendly tool to create professional organizational charts for my sales team. Ideally, it should be intuitive, visually appealing, and capable of handling complex hierarchies with ease. Key requirements include:
- Ease of Use: A drag-and-drop interface or simple data import (e.g., from Excel or CSV) to quickly build and edit charts.
- Customization: Options to add photos, job titles, contact details, and color-code departments or roles.
- Collaboration: Real-time editing and sharing features for team input or presentations.
- Integration: Compatibility with tools like Salesforce, HubSpot, or HR systems for seamless data syncing.
- Scalability: Ability to manage charts for teams of 50+ people without performance issues.
- Export Options: High-quality PDF, PNG, or interactive formats for reports or client pitches.
I’ve looked at tools like Lucidchart, Visio, and Canva, but I’m curious about other options or hidden gems that might also use org charts effectively. What tools do you recommend for creating org charts? Bonus points for affordable pricing or free tiers suitable for small to medium-sized sales teams looking to learn how to create effective org charts. Please share your experiences, including pros, cons, or any workarounds you’ve found helpful!
Components of Organizational Charts
Effective org charts typically include basic org charts that define roles and reporting lines.
- Roles and Titles: Clearly defined positions (e.g., Sales Manager, Account Executive).
- Hierarchy: Lines showing reporting relationships are essential for a clear traditional org chart.
- Names and Photos are crucial elements in creating an organizational chart that clearly depicts the chain of command.: Personalizing team members for better recognition.
- Departments and employee directories are essential for understanding the chain of command in a business.: Grouping by function (e.g., Sales, Marketing).
- Contact Information: Emails or phone numbers for quick communication.
Vertical or Hierarchical Organizational Chart
A vertical (or hierarchical) org chart is the most common format, displaying a top-down structure. The CEO or head of sales sits at the top, with layers of management and team members below. This format excels in clarifying authority and accountability but may feel rigid for flatter or agile teams.
Limitations of an Organizational Chart
While useful, org charts have drawbacks:
- Static NatureThey may not reflect real-time changes like promotions or turnover in the organization’s structure.
- Oversimplification of the reporting structure can lead to misunderstandings.: Complex team dynamics or informal relationships may be omitted.
- Scalability Issues: Large teams can make charts cluttered or hard to navigate.
- Lack of Context in the organizational structure can lead to confusion and inefficiency.They don’t capture workflows, decision-making processes, or cultural nuances found in the organization’s structure.
How to Craft UML Diagrams
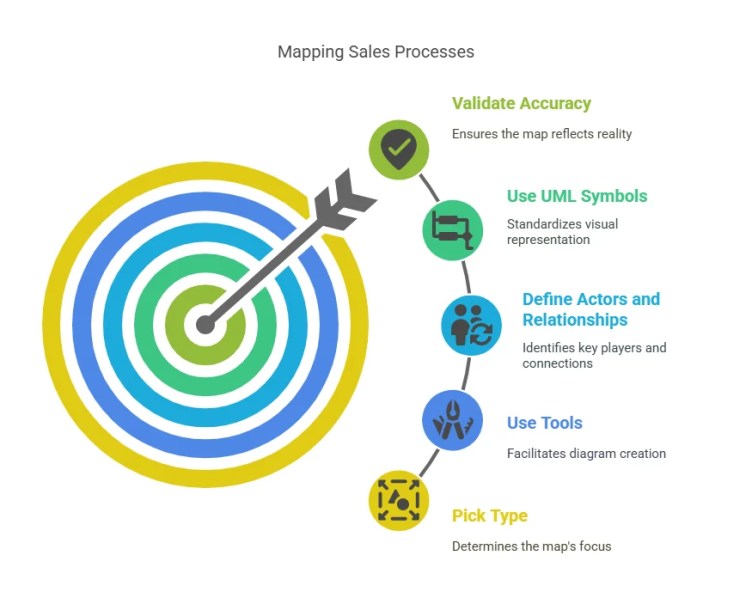
Unified Modeling Language (UML) diagrams, while distinct from org charts, can complement them by mapping processes or system interactions in sales operations. To create UML diagrams:
- Choose a Diagram Type: Use case diagrams for customer interactions or class diagrams for CRM system structures.
- Select a Tool: Opt for tools like Lucidchart, Draw.io, or Enterprise Architect with UML support to easily create an organizational chart.
- Define Elements: Identify actors (e.g., sales reps, clients) and relationships (e.g., data flows).
- Design Visually: Use standardized UML notation (e.g., rectangles for classes, arrows for associations).
- Validate: Ensure the diagram aligns with the sales process or system it represents.
Step 1: Gather Your Data
First things first, you need some data with clear relationships. No, I’m not talking about office romances—unless that’s what you’re trying to map out (hey, no judgment!). What you really need is data showing who reports to whom in your organization. For this example, I’ve got all my org data neatly stored in a Microsoft Excel file.
In my Excel sheet, I’ve listed everyone’s name and their reporting managers in an organizational structure chart in Excel. Titles are optional, but they can be helpful. For instance, Patti is our company president, so she’s at the top of the chart. She has four direct reports, including me, and one of her reports, Nestor, also has his own team.
If you don’t have Excel, don’t worry! This data could come from Word, an email, or even a Notepad file, which can be used to visualize the organization’s structure. The key is making sure the relationships are clearly defined.
Step 2: Copy Your Data
Once your data is ready, it’s time to copy it. Simply select your data, press Ctrl + C, and you’re good to go. The data will be placed on your clipboard, ready to be used in your employee directory or org chart.
Step 3: Head to Bricks.com

Now, let’s put that data to work. Go to Bricks.com (I’ve included a link for your convenience). Bricks is a fantastic tool that leverages AI to help you create org charts and many other visuals quickly and easily, making it a great alternative to Microsoft Word for Mac.
If you haven’t heard of Bricks before, it’s a new service that integrates with various platforms to enhance your ability to create cross-functional org charts. AI into spreadsheets and documents, making it super simple to generate an org chart. Trust me, it’s way easier than doing it in Word, PowerPoint, or Visio, especially with tools that utilize the SmartArt design tab.
Step 4: Create Your Org Chart
Once you’ve signed up and logged in to Bricks, you’ll find yourself in a new chat. On the left-hand side, you’ll see various options, including the ability to create roadmaps, timelines, lists, tables, and more, all of which can be part of a professionally designed org chart. But for now, let’s focus on our org chart.
At the bottom of the chat, type “make an org chart” and hit Shift + Enter. Then, paste the data you copied from Excel into the text pane of your org chart in Word. Bricks will recognize the data and generate your org chart automatically.

Step 5: Customize the Style
Now that your org chart is generated, you can have some fun with it! Bricks offers various styles to choose from. You can swap styles with a simple click and see what works best for your organization. Want to add photos? No problem! Choose a style that includes placeholders for images and upload them directly to create an organization chart.
Step 6: Edit and Update
What if there’s a mistake or you need to make changes? Easy! Just click on any part of the org chart to edit. For example, my title was mistakenly listed as “Cookie Monster” (which, let’s be honest, is somewhat true), but I needed to update it to “Content Creator.” It’s as simple as clicking, typing, and hitting enter.
You can also add new employees or update existing ones to improve your organization’s structure. Bricks keeps all your data in a spreadsheet format, so any changes you make in the org chart will be reflected in the underlying data, and vice versa.
Step 7: Export and Share
Once you’re happy with your org chart, it’s time to export it. Click the download icon in the top right corner, and you can choose to save it as an image (PNG) or a PDF of your organization chart, which visually represents the hierarchy within an organization. This is perfect for sharing in presentations or sending out to the team using basic org charts.
Extra Features: Advanced Customization and Presentation Mode
Bricks also allows you to add more context to your org chart by sending it to a “board” view, where you can add text, charts, and other elements. This feature is great for presentations where you need to provide additional information. You can even enter presentation mode directly from Bricks, making it a one-stop solution for all your org chart needs at the top level.

Some other Platforms to Create an Organizational Chart Online?
Below are some of the easiest online platforms for creating organizational charts, known for their intuitive interfaces and accessibility:
- Canva:
- Why: Offers a free tier with drag-and-drop templates, ideal for beginners. No design skills required.
- How: Choose an org chart template, add names, photos, and customize colors, then download as PNG or PDF.
- Pros: Visually appealing, user-friendly, and free for basic use.
- Cons of using basic templates for organization charts.: Limited for complex hierarchies or integrations.
- Lucidchart:
- Why: Provides a robust free tier with drag-and-drop functionality and real-time collaboration.
- How: Import data from Excel or CSV, customize with photos and details, and export in multiple formats.
- Pros: Integrates with Salesforce and Google Drive, making it scalable for larger teams using an organizational chart template.
- Cons: Advanced features require a paid plan.
- Creately:
- Why: Features simple templates and an intuitive interface, with collaboration tools.
- How Use pre-built shapes to build charts, add details, and share via links or exports in the design tab.
- Pros: Affordable, supports UML diagrams and flowcharts too.
- Cons: Fewer integrations compared to Lucidchart.
- SmartDraw:
- Why Combines ease of use with powerful automation for quick chart creation using SmartArt tools.
- How: Import data or build manually, customize with themes, and export as PDF or PNG.
- Pros Integrates with Microsoft Office and HR systems to enhance the organization chart.
- Cons: Free trial is limited; full features require purchase.
- Draw.io (diagrams.net):
- Why: Completely free, browser-based, and integrates with cloud storage like Google Drive.
- How: Select an org chart template, add roles and connections, and save or export.
- Pros No cost, open-source, and highly customizable organization chart.
- Cons: Less polished than paid tools like Canva or Lucidchart.
Recommendation: Utilize a free organizational chart tool to visualize your team’s hierarchy effectively.: For the easiest experience, consider using the drag and drop feature available in many org chart tools. Canva is ideal for small teams due to its simplicity and free templates. For more advanced needs, Lucidchart or Draw.io offer greater flexibility and scalability.
FAQs: Creating an Organizational Chart Easily
1. What is the easiest way to create an org chart?
The easiest way to create an org chart is by using a tool like Bricks. All you need is a list of people and their managers. You can then copy this data into Bricks, which automatically generates a professional-looking org chart.
2. Can I use data from Excel to create an org chart?
Yes, you can easily use data from Excel. Simply list the names of the people in your organization, who they report to, and any optional titles. Copy this data into Bricks, and it will generate the org chart for you.
3. What if I have my data in another format, like Word or Notepad?
No problem! As long as your data includes the relationships between people (who reports to whom), you can copy and paste it into Bricks from Word, Notepad, or even an email.
4. How do I add pictures to my org chart?
After generating your org chart in Bricks, you can choose a style that includes placeholders for photos. You can then upload images for each person to make your org chart more personalized.
5. Can I customize the style of my org chart?
Yes, Bricks offers multiple styles for your org chart. You can switch between styles to find the one that best fits your organization’s needs, including options with color and photo placeholders.
6. How do I update my org chart if my organization changes?
You can easily update your org chart by editing the underlying data in Bricks. If you add a new employee or change someone’s role, just update the data, and your org chart will automatically reflect the changes.
7. Can I filter the org chart to show only certain teams or departments?
Yes, you can filter the data in Bricks to display only specific teams or departments. This is especially useful if you need to create a chart for just the senior leadership team or another specific group.
8. How can I share my org chart with others?
Once your org chart is ready, you can export it as a PNG image or PDF. You can also share it directly from Bricks, allowing others to view or even edit the chart if needed.
9. What other visuals can I create using Bricks?
Besides org charts, Bricks allows you to create timelines, infographics, team member views, and many other types of visuals, all based on your data. These visuals will update automatically if your underlying data changes.
10. Is Bricks free to use for creating org charts?
Yes, Bricks is completely free and offers a user-friendly interface to create org charts and other visuals effortlessly.
11. How to Create Your Own Organizational Chart in Word?
Open Microsoft Word and go to the org chart in Word feature to create your organizational chart. Go to the insert tab to access various org chart design options. tab.
Select SmartArt > Hierarchy and choose an org chart layout that best fits your organizational structure.
Add roles by clicking on shapes and typing names, titles, or departments.
Customize shapes, colors, and lines via the Design and Format your organization chart template for better clarity and presentation using a smartart graphic. Design tab for customizing your organization chart.
Save or export as a PDF for sharing.
Tip: Word is best for simple charts but lacks advanced features for large teams.
12. Best Way to Create a Flowchart?
Choose a Tool: Use Lucidchart, Visio, or Draw.io for flexibility and templates.
Define the Process of creating an organizational chart template to streamline team structure visualization.: Map out steps, decisions, and outcomes (e.g., sales pipeline).
Use Standard SymbolsOvals for start/end, rectangles for steps, diamonds for decisions can be created step-by-step using SmartArt tools.
Design Clearly: Keep layouts clean with consistent colors and fonts.
Test and Share: Validate the flowchart with stakeholders and export as PNG or PDF, ensuring it reflects the hierarchy within an organization.
Recommendation: Lucidchart offers robust templates and collaboration for flowcharts.
13. Best Way to Create an Org Chart in PowerPoint?
Open PowerPoint and go to Insert > SmartArt > Hierarchy.
Select an org chart template and add roles by editing text in shapes.
Customize via Design > SmartArt Styles For colors and layouts, you can explore different org chart design options.
Add images or icons from Insert > Pictures or Icons For visual appeal, use org charts to visualize important data clearly.
Export as a slide or PDF for presentations of your organization chart.
Note PowerPoint is great for quick charts but limited for dynamic updates in a collaborative environment, unlike an org chart in Excel.
14. Why Should Organizations Be Encouraged to Have an Organizational Chart?
ClarityDefines roles and reporting lines, reducing confusion in sales teams, making creating org charts more efficient.
Efficiency can be greatly improved by using a traditional org chart that clearly defines reporting relationships.Streamlines decision-making and communication within the reporting structure.
Onboarding: Helps new hires understand team structure quickly.
ScalabilitySupports growth by visualizing expansion or restructuring in the organization chart.
Professionalism: Enhances presentations for clients or investors.
15. What is the Easiest Program to Create an Organizational Chart Online?
Canva is one of the easiest online tools for creating org charts:
Why: Offers free templates, drag-and-drop interface, and no design skills needed.
How: Select an org chart template, customize with names and photos, and download as PNG or PDF.
Pros: Free tier, intuitive, and visually appealing.
Cons: Limited for complex hierarchies or integrations.
Alternatives like Lucidchart or Creately offer more advanced features but may have a steeper learning curve.
Conclusion: A Quick and Easy Solution
Creating an org chart doesn’t have to be a chore. With Bricks, it’s quick, easy, and even a little bit fun. Whether you’re updating your team structure or preparing for an all-hands meeting, Bricks has the tools you need to create a professional and visually appealing org chart in minutes. Give it a try, and you’ll wonder how you ever managed without it.


0 Comments on “Create an Organization Chart easily: Simple Org Chart Guide”